viewof band = Inputs.select(
  ["delta", "theta", "alpha", "beta", "gamma", "high_gamma"],
  {
    label: "Frequency band",
    format: x => ({
      delta:      "δ (0.5–4 Hz)",
      theta:      "θ (4–8 Hz)",
      alpha:      "α (8–13 Hz)",
      beta:       "β (13–30 Hz)",
      gamma:      "γ (30–80 Hz)",
      high_gamma: "hγ (80–150 Hz)"
    })[x],
    value: "beta"
  }
)

viewof mrf = Inputs.radio(["T1", "T2"], { label: "MRF type", value: "T1" })

viewof condition_set = Inputs.select(
  ["background", "periictal_10s", "periictal_20s", "periictal_30s", "delta"],
  {
    label: "Condition",
    format: x => ({
      background:    "Background (4AM / 4PM)",
      periictal_10s: "Peri-ictal ±10s",
      periictal_20s: "Peri-ictal ±20s",
      periictal_30s: "Peri-ictal ±30s",
      delta:         "Δ Post–Pre"
    })[x],
    value: "background"
  }
)Week of 2026-05-18
MRF-PSD correlations, BME-X outputs
Cross-correlation frequency band against T1/T2
One of the suggestions during lab meeting was plotting ALL values against band power, Which I have below.
Use the selectors below to browse scatter plots of MRF (T1 or T2) vs. mean normalized band power, stratified by epileptogenic zone. Each panel shows whole-contact (top) and GM-only (bottom) values, for raw and VEP-normalized MRF side by side.
As you can see from cycling through these, there isn’t really much of a linear relationship that we see between any particular frequency band and T1 or T2, whether we are looking at raw value or Z-score value from the VEP approach.There is mostly a cloud of values, I think any of the graphs that do show a bit of correlation are likely driven by 1-2 extreme values.
syn7T - Review of BME-X segmentation outputs
FAST-based segmentation figures from Mary: absolute tissue volumes (CSF, GM, WM) across baseline 3T, Arm 1 (BME-X processed 3T), and true 7T, plus within-subject Dice/IoU and volume-bias deltas relative to baseline.
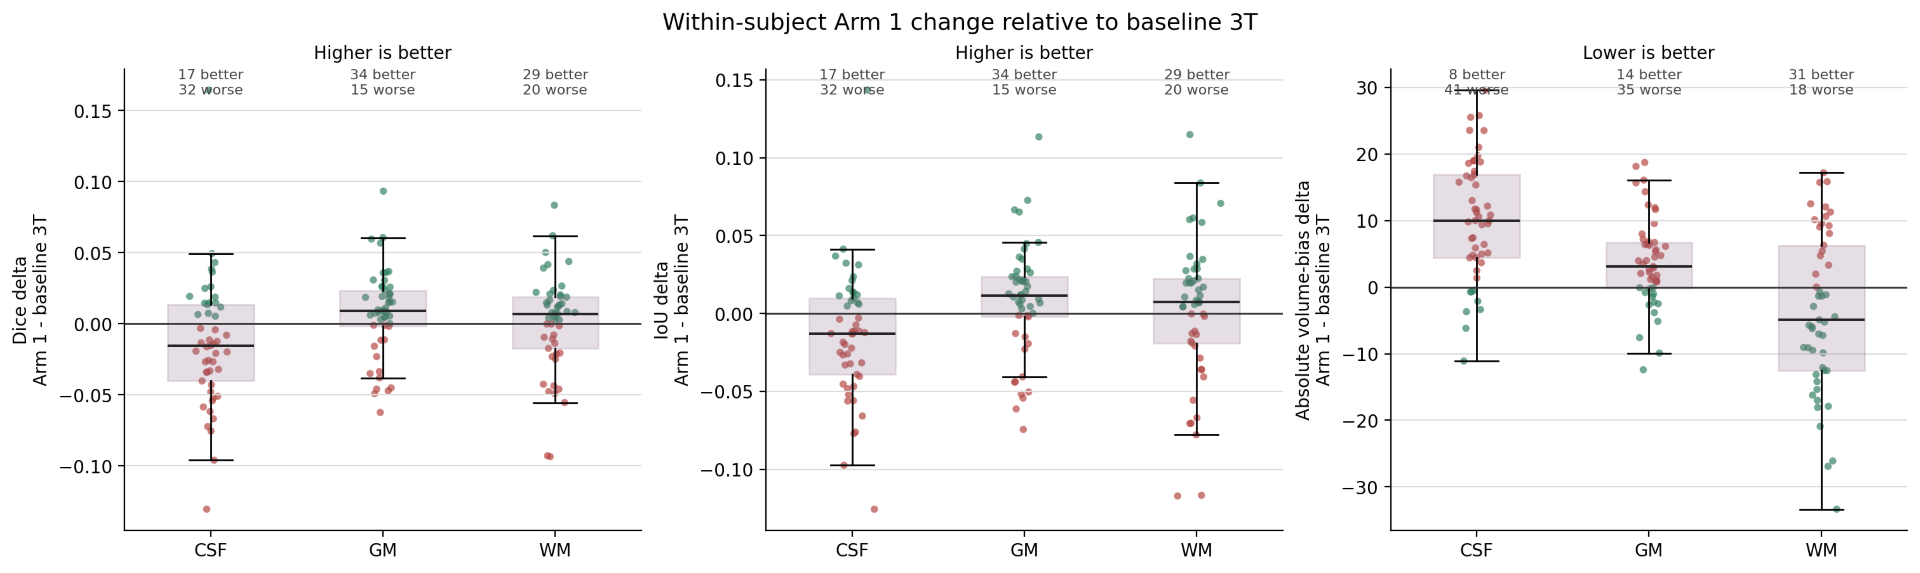
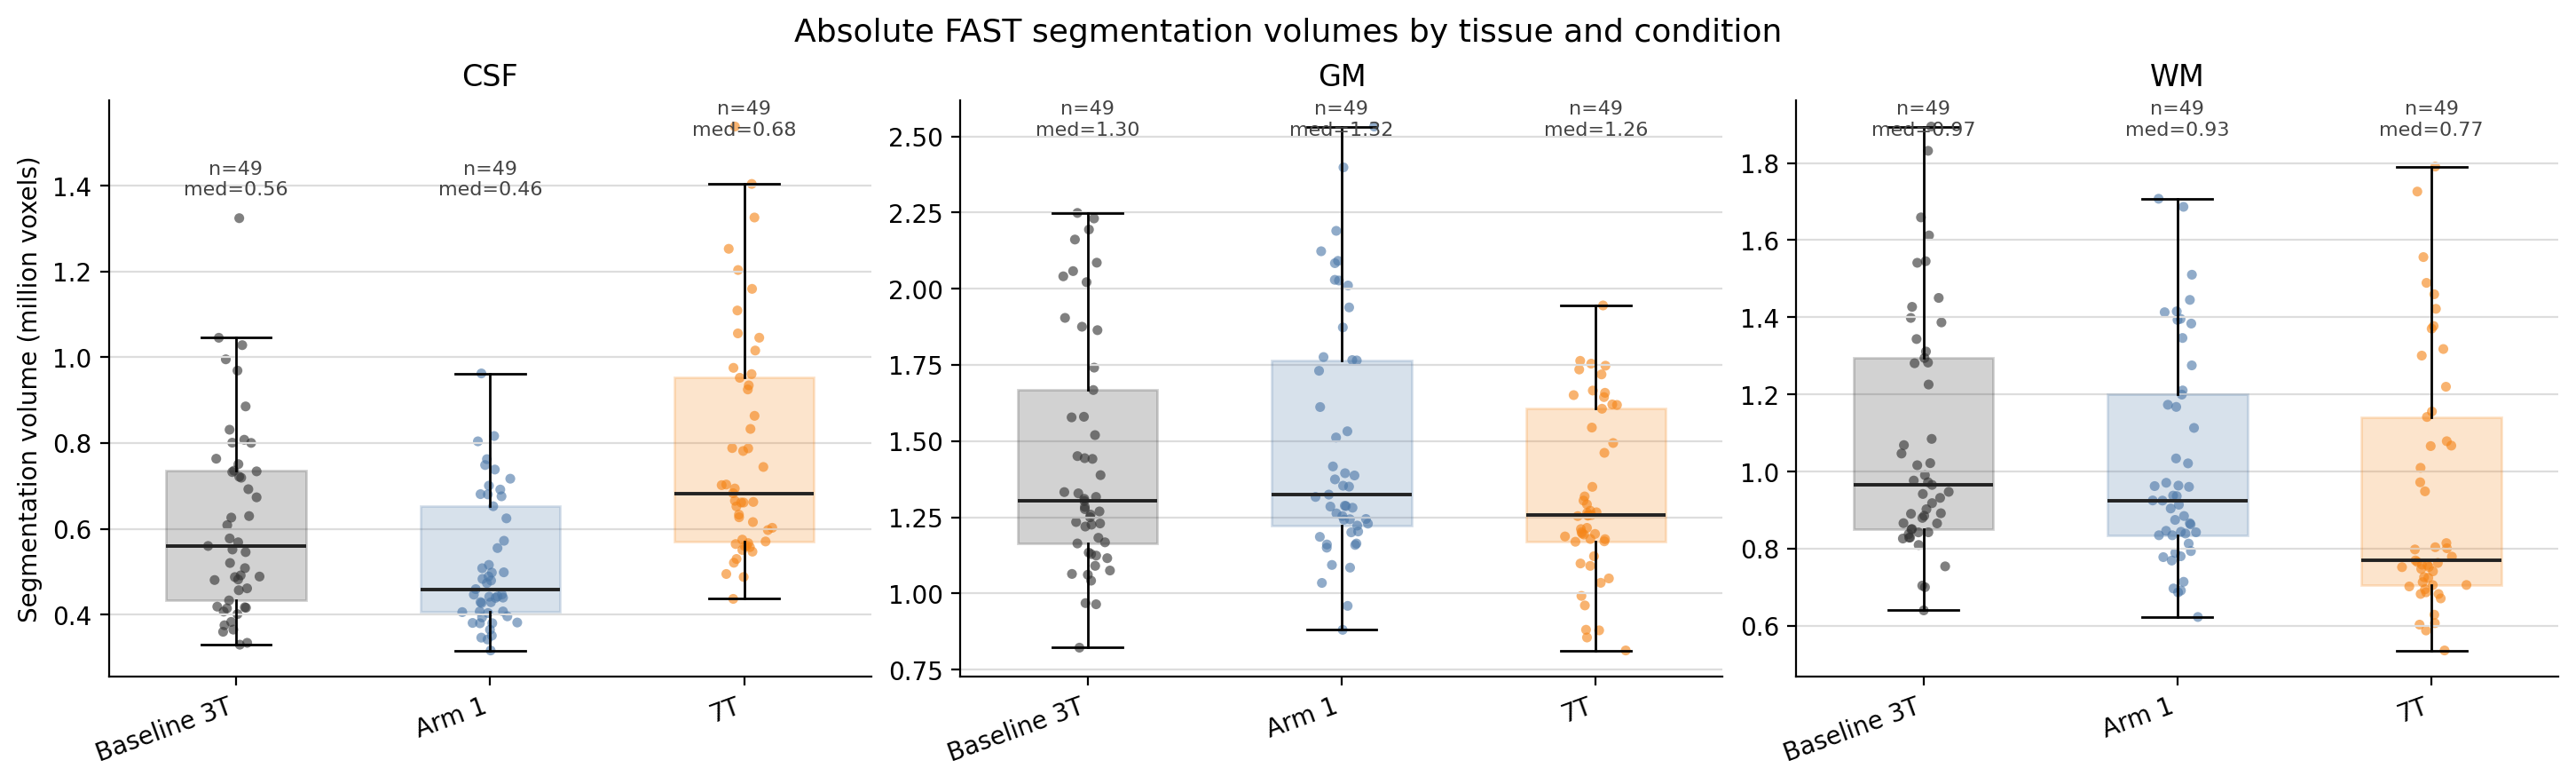
The delta figures show Arm 1 performance centered at zero or slightly negative for most tissues, with WM showing the clearest degradation. Visual tissue overlays confirm Arm 1 images appear less crisp than baseline 3T. I think BME-X makes nice-looking images but runs the risk of washing out relevant details, we’ll likely use just the raw 3T as inputs. We could consider a separate experiment once our initial model is trained to use the BME-X processed images as inputs as well.