Week of 2026-06-01
syn7T pix2pix initial run
syn7T Progress
pix2pix Initial Run
- Train/test split: 36 subjects trained, 7 tested, 8 held out for validation
- Input: concatenated 2D paired slices from aligned 3T and 7T volumes
- Slice inclusion: >1% nonzero area
- Generator: unet_256 (standard pix2pix)
- Resolution: 256×256 (default pix2pix resize/crop)
- Training time: ~8 hours
Results
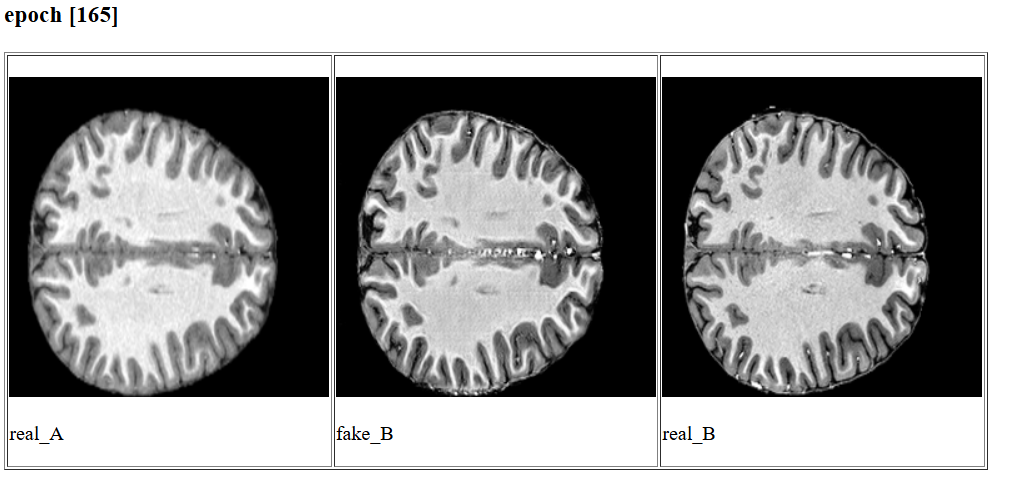
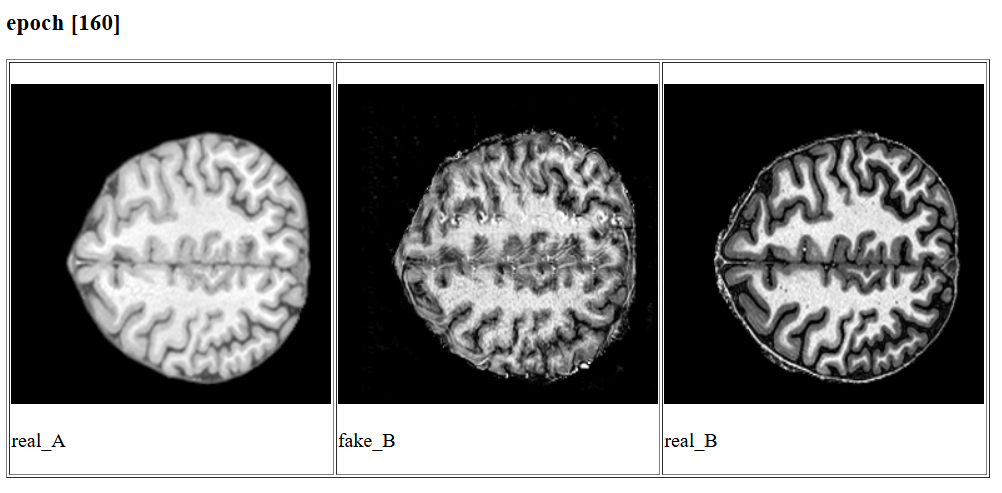
Output quality was mixed - see examples below. Some synthesized images were visually reasonable; others showed substantial noise and artifacts, likely related to edge slices and the resize/crop preprocessing step.
Next steps:
- Raise the slice threshold from >1% to >10% nonzero area - removes edge slices that may amplify skull-stripping and registration artifacts
- Increase resolution to 512×512 with zero padding - removes the model’s internal resize/crop step, preserving spatial fidelity
- Test a 2.5D approach - provide neighboring slices as additional input channels while predicting the center slice (pix2pix supports multi-channel input natively)
MRF-SEEG - Distance from EZ idea
Added a spatial dimension to the MRF-SEEG analysis by computing Euclidean distance from each SEEG contact to the “EZ centroid”.
EZ centroid was computed per patient as the mean x/y/z coordinate of all ict_onset_yn == 1 contacts. EZ radius was defined as half the maximum pairwise Euclidean distance among EZ contacts (i.e., the radius of the smallest enclosing sphere).
Distance was expressed both in raw mm and normalized by the EZ radius (half the maximum pairwise distance among EZ contacts), allowing comparison across patients with different EZ sizes and sampling densities.
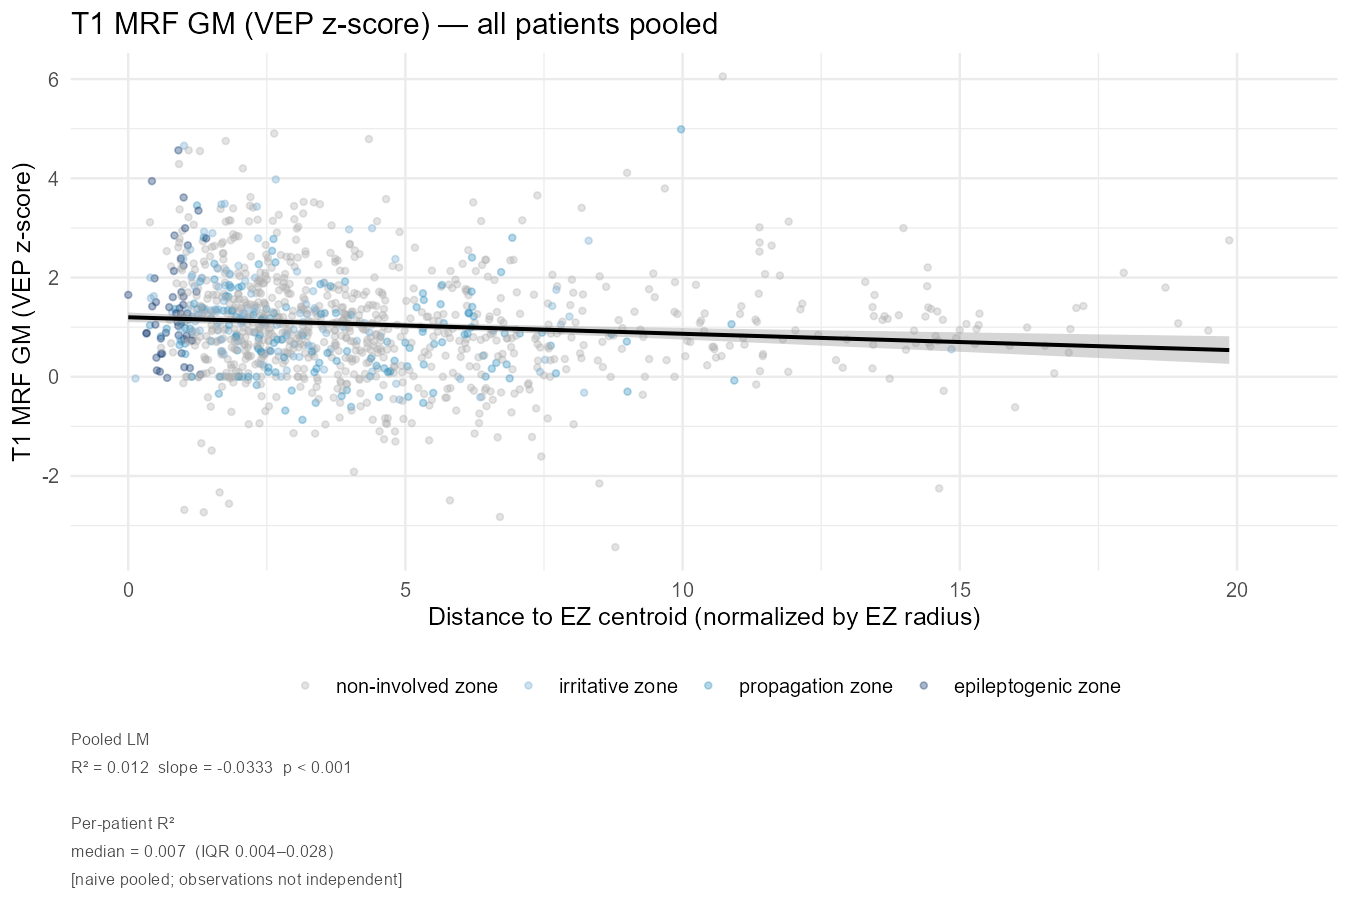
All contacts were included (no distance cutoff), and figures were generated for T1 and T2 MRF, separately for GM-only voxels and the full spherical ROI, using both raw ms values and VEP z-scores.
Pooled analysis
Across all patients pooled, there is a consistent negative relationship between MRF values and distance from the EZ centroid: contacts closer to the EZ tend to have higher T1 and T2 relaxation times, consistent with perilesional tissue abnormality (?).
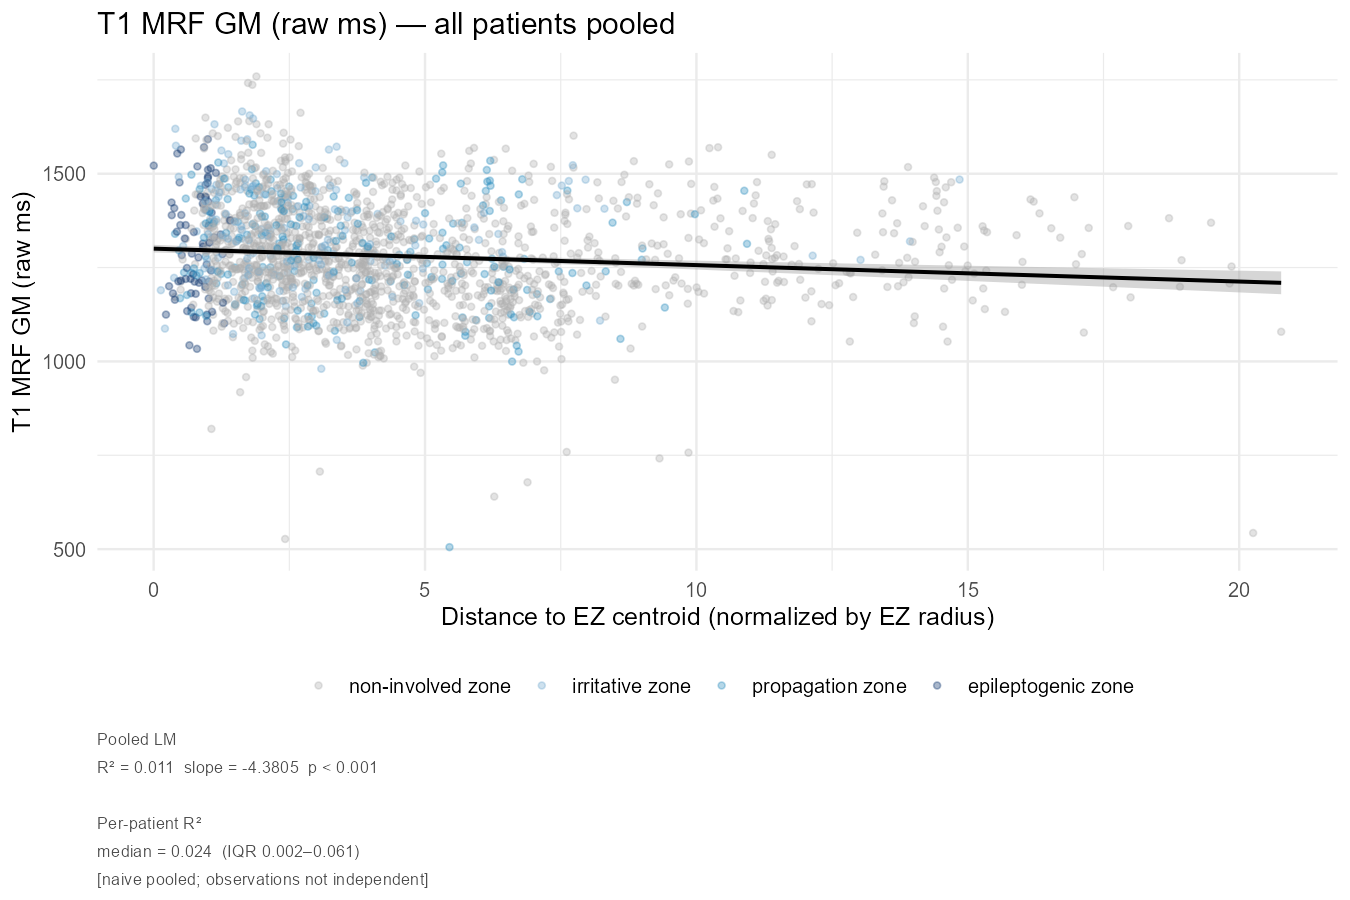
For T1 GM raw, the pooled LM shows R²=0.011, slope=-4.38, p<0.001. The per-patient R² median is 0.024 (IQR 0.002-0.061), indicating substantial heterogeneity across patients.
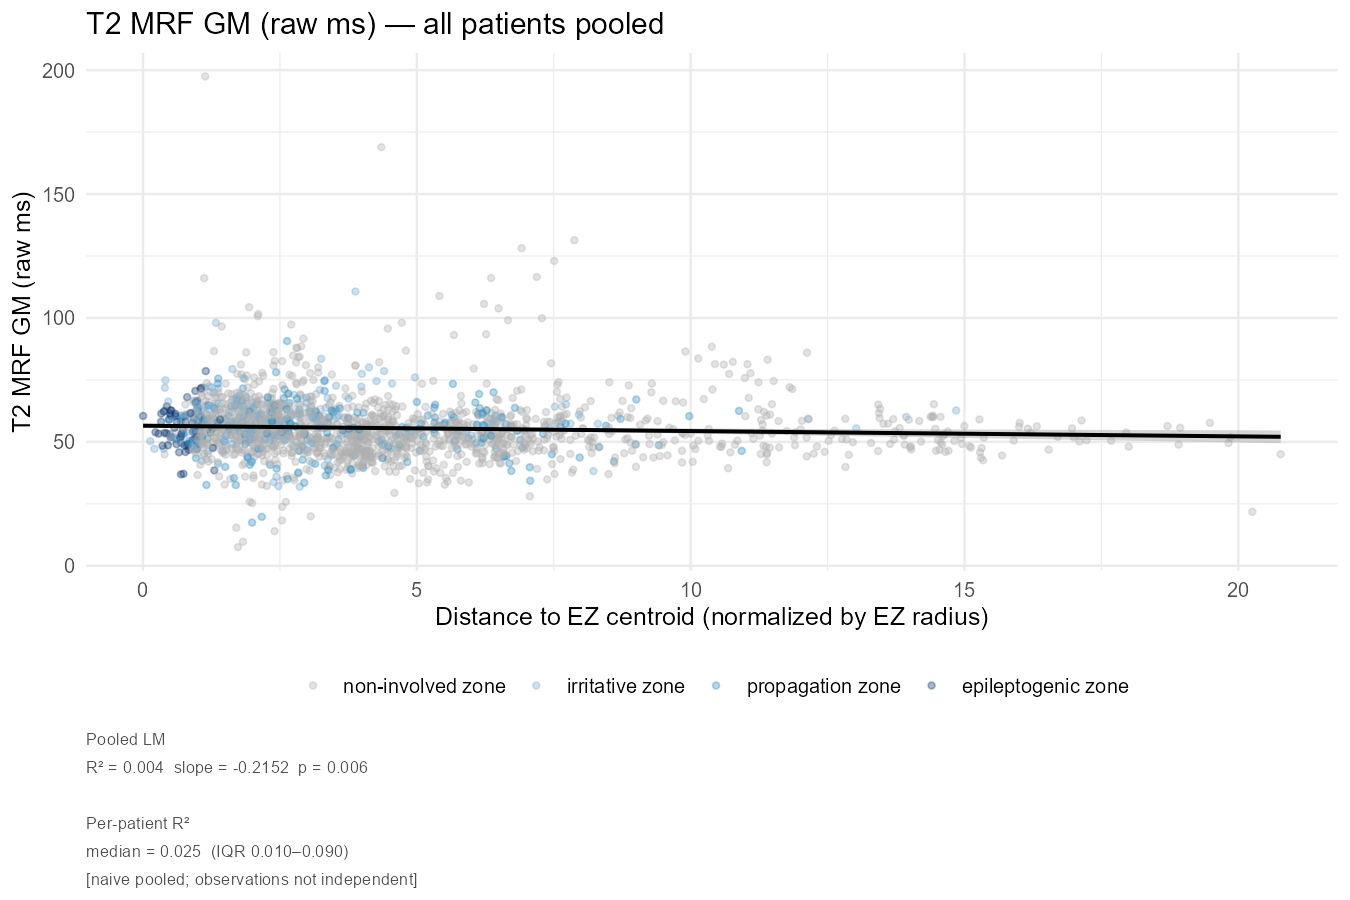
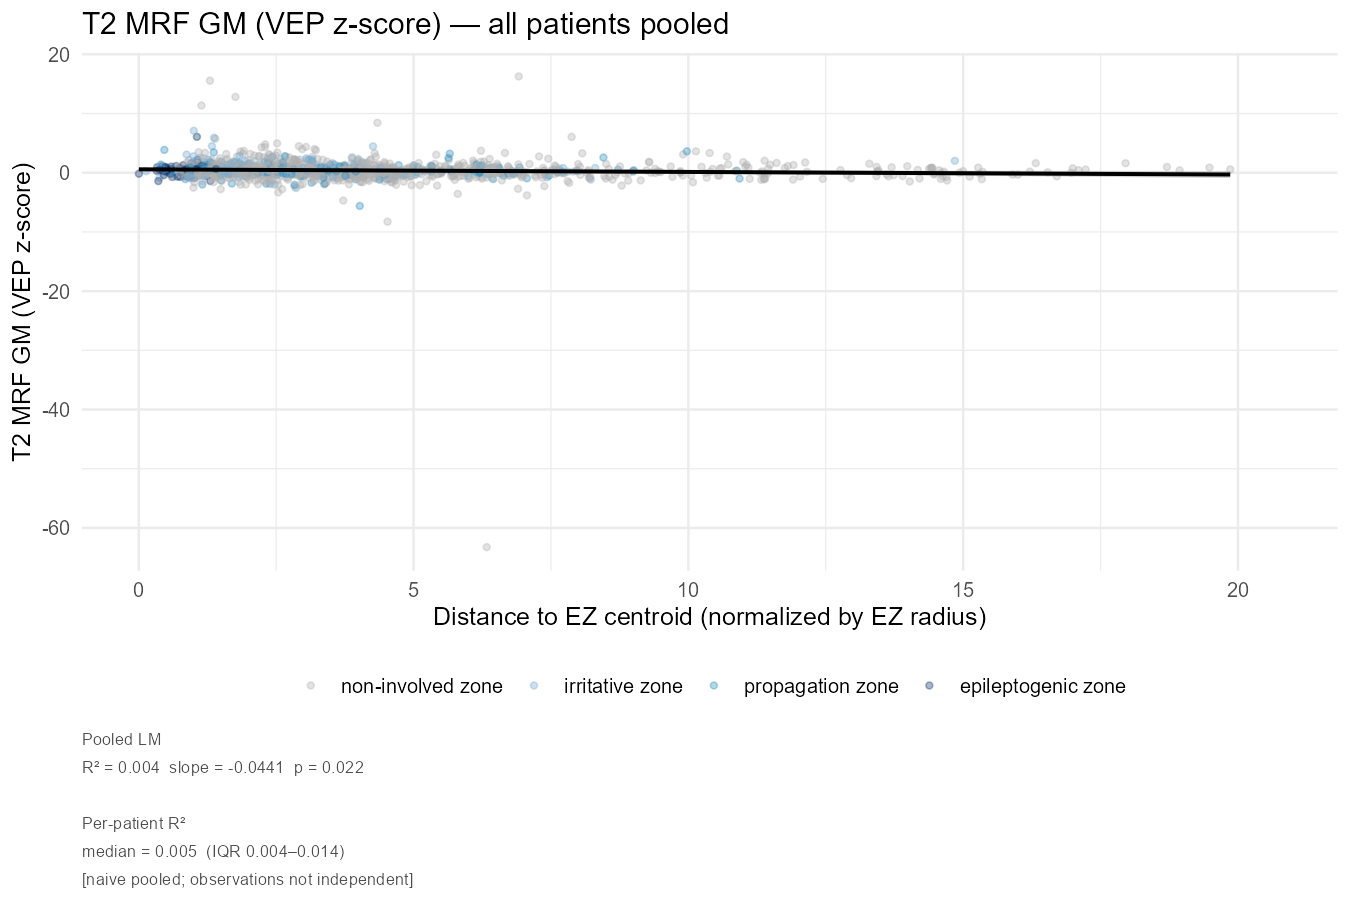
T2 GM raw shows a weaker but still significant negative slope (R²=0.004, slope=-0.22, p=0.006). T2 VEP z-score is the weakest association (R²=0.004, p=0.022), and there is a notable outlier around normalized distance ~7, z-score ~-65, not sure what’s going on there I need to take a look.
The VEP z-score figures are interpretively cleaner, (i.e. the normalization removes between-patient scaling differences) but the T2 VEP z-score distribution is heavily compressed near zero.
Per-patient analysis
The faceted views reveal considerable heterogeneity that the pooled figures obscure.
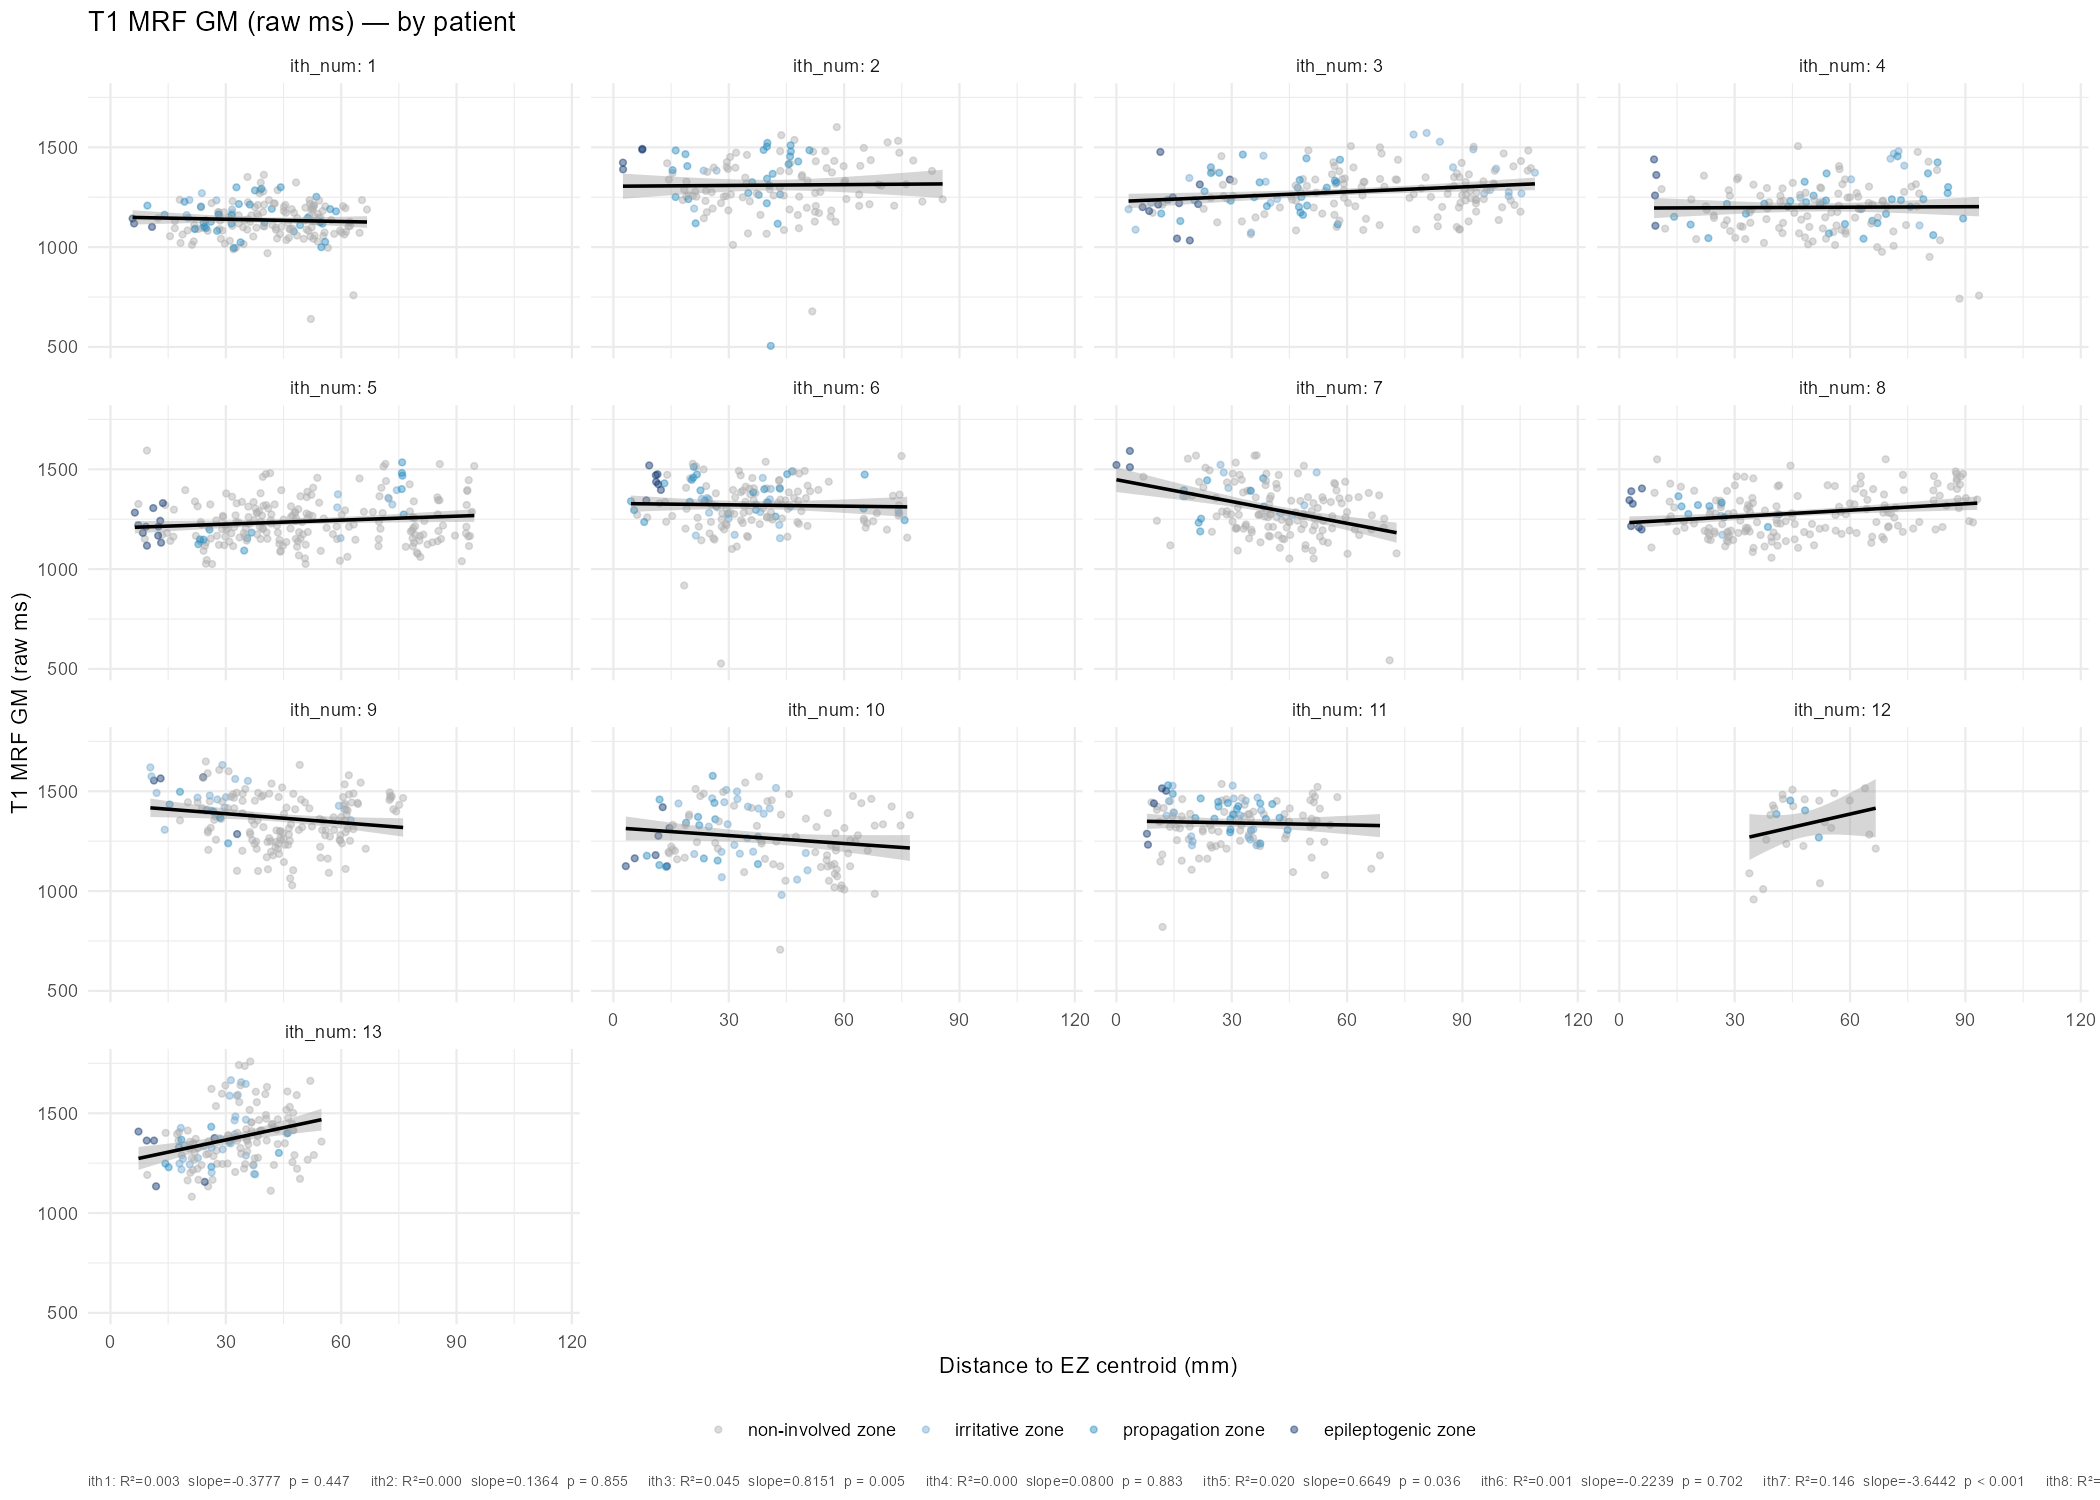
For T1 GM raw, the expected negative slope (higher MRF near EZ) is present in several patients (notably ith7: R²=0.146, slope=-3.64, p<0.001; ith9, ith10), but is absent or reversed in others (ith13: positive slope; ith1, ith4: near-flat). This is not surprising given the heterogeneous etiology and electrode coverage across patients, but it limits the strength of a simple distance-based claim at the group level.
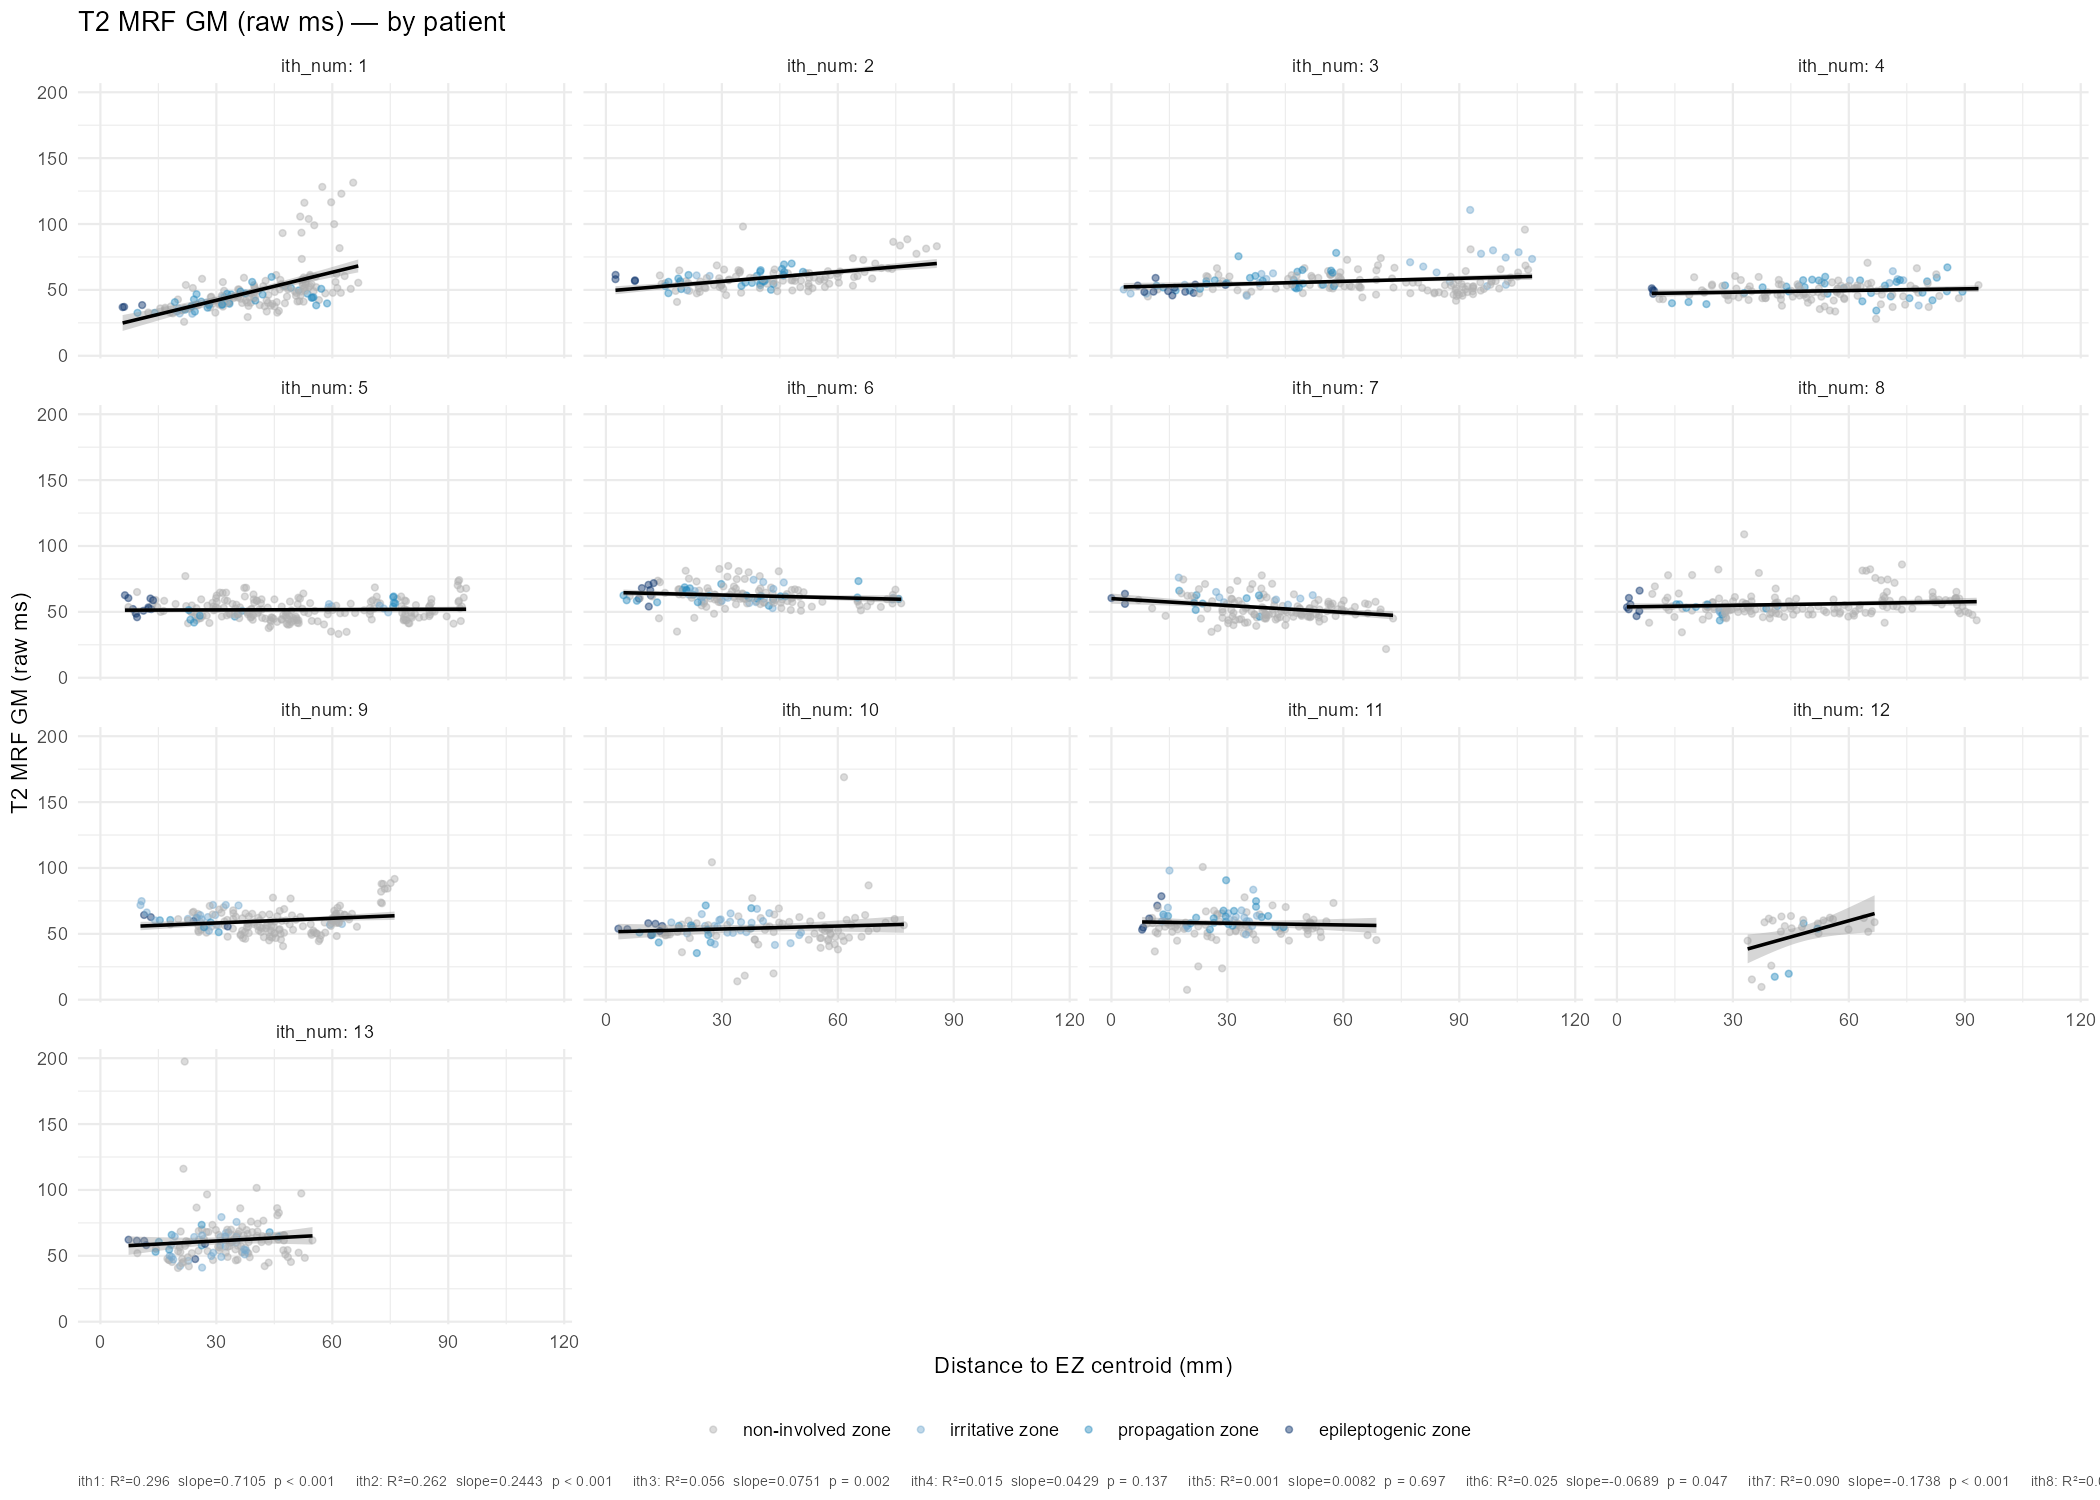
T2 GM raw shows a interesting case in ith1 (R²=0.296, slope=+0.71, p<0.001) with a positive relationship, opposite to the group trend. Need to look into this. ith2 also shows a positive slope with reasonable R² (0.262, p<0.001). Several other patients are near-flat and non-significant.
The overall picture may be consistent with a mild but real perilesional MRF signal — T1 relaxation times are modestly elevated near the EZ centroid across the cohort, in keeping with the known sensitivity of T1 MRF to subtle cortical dysplasia and gliosis. The effect is stronger for T1 than T2, and stronger in raw ms than VEP z-score (possibly because VEP normalization partially removes the signal of interest?).
The heterogeneity across patients likely reflects: (1) variable etiology (structural vs. non-lesional), (2) variable electrode sampling; (3) the EZ centroid being a crude spatial marker of the “true” seizure onset zone.
Next steps
- I need to look at this using resection labels - i.e. electrode contact included in resection or not
- Look into outliers above
- ?geodesic distance instead of Euclidean