Lab Meeting
MRF-SEEG
Group-level scatter plots (May)
Following the April meeting action item to plot MRF against individual frequency bands, interactive scatter plots were generated for all six frequency bands (δ, θ, α, β, γ, hγ) × T1/T2 × condition (background, peri-ictal ±10/20/30s, Δ post-pre), stratified by epileptogenic zone. Whole-contact and GM-only values shown side by side with raw and VEP-normalized MRF.
Takeaway: No clear linear relationship between any frequency band and T1 or T2 at the group level. Results appear as a cloud of values; any apparent correlations appear driven by 1-2 extreme values.
Shift to per-patient analysis (May)
Following Balu’s feedback that pooling across patients diffuses findings due to inter-patient variability, analysis was shifted to a per-patient, zone-stratified Spearman ρ framework. Computed per patient × band × MRF column × condition, stratified by zone (EZ / NIZ / ALL contacts).
Note: Small number of EZ contacts per patient leads to artificially inflated within-patient EZ correlations. Zone label exclusivity is a known limitation - action item from last meeting to address this is ongoing.
Distance from EZ analysis (June 1)
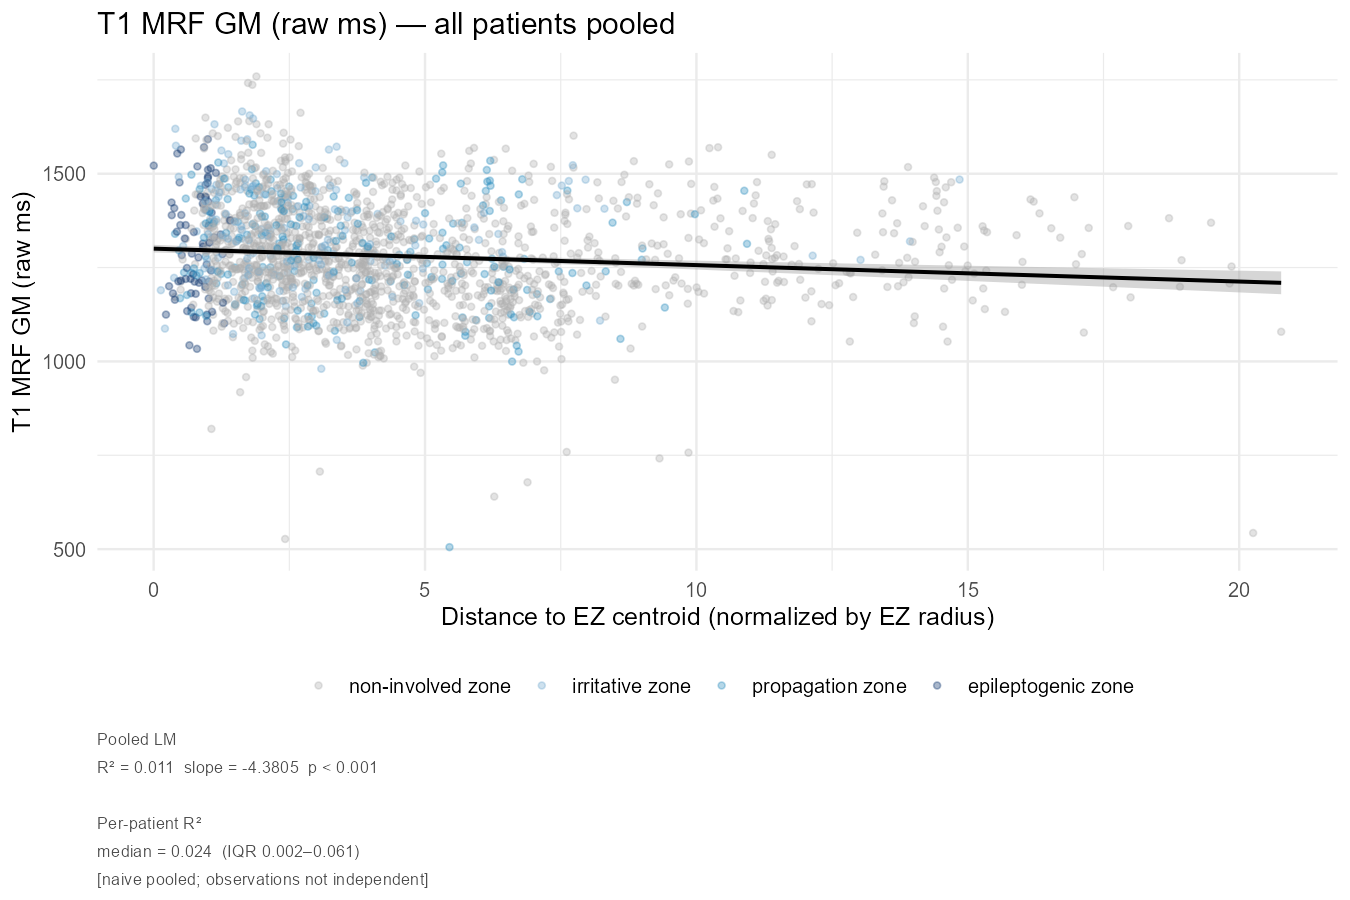
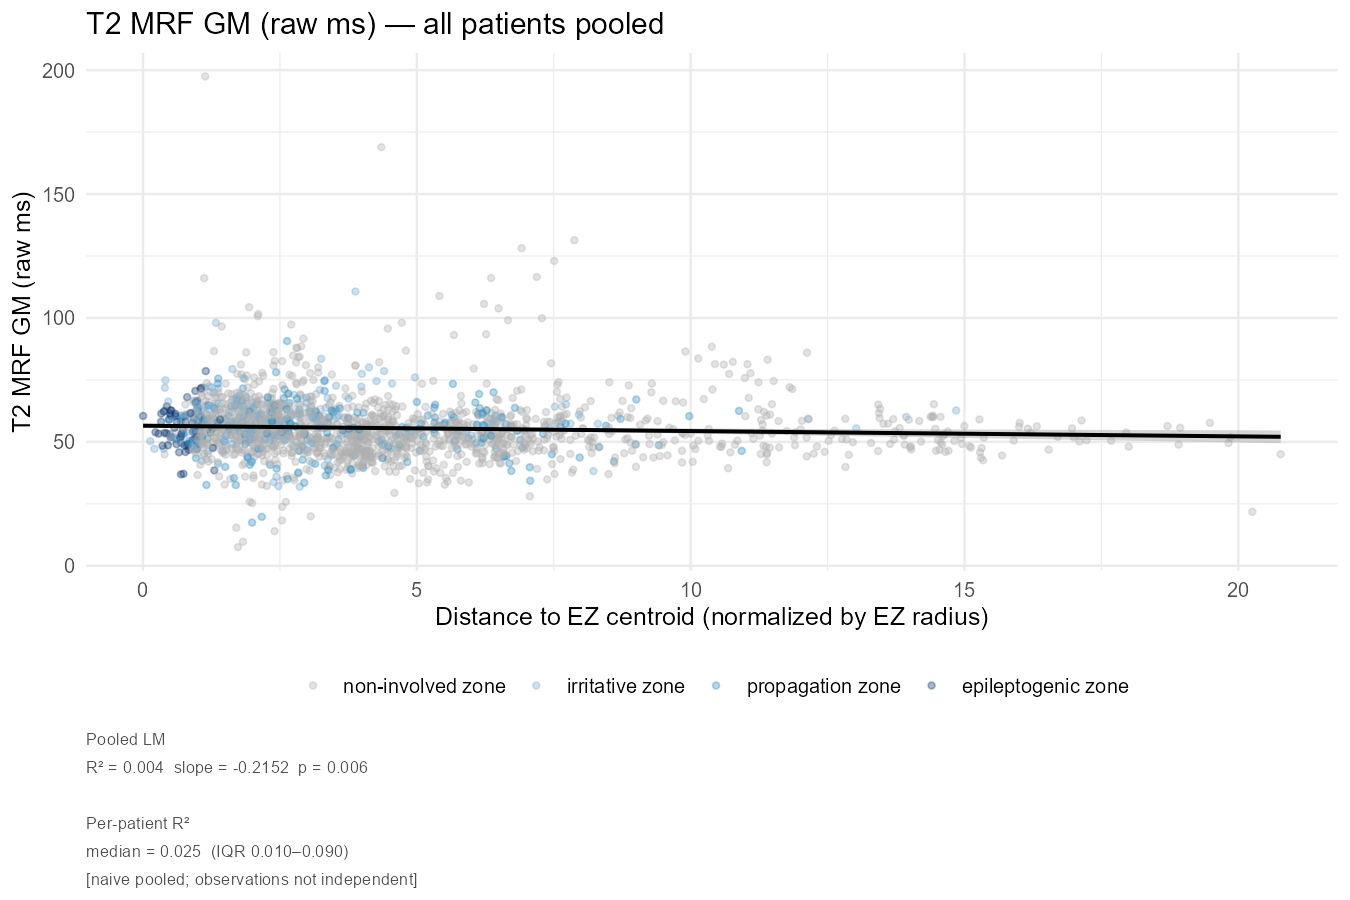
Added a spatial dimension by computing Euclidean distance from each SEEG contact to the EZ centroid (mean x/y/z of all ict_onset_yn == 1 contacts). EZ radius defined as half the maximum pairwise Euclidean distance among EZ contacts. Distance expressed in raw mm and normalized by EZ radius to allow cross-patient comparison.
Pooled findings: Consistent negative relationship between MRF values and distance from EZ centroid across the cohort - contacts closer to the EZ tend to have higher T1 and T2 relaxation times, consistent with perilesional tissue abnormality. T1 GM raw: R²=0.011, slope=-4.38, p<0.001. T2 GM raw: weaker but significant (R²=0.004, slope=-0.22, p=0.006).
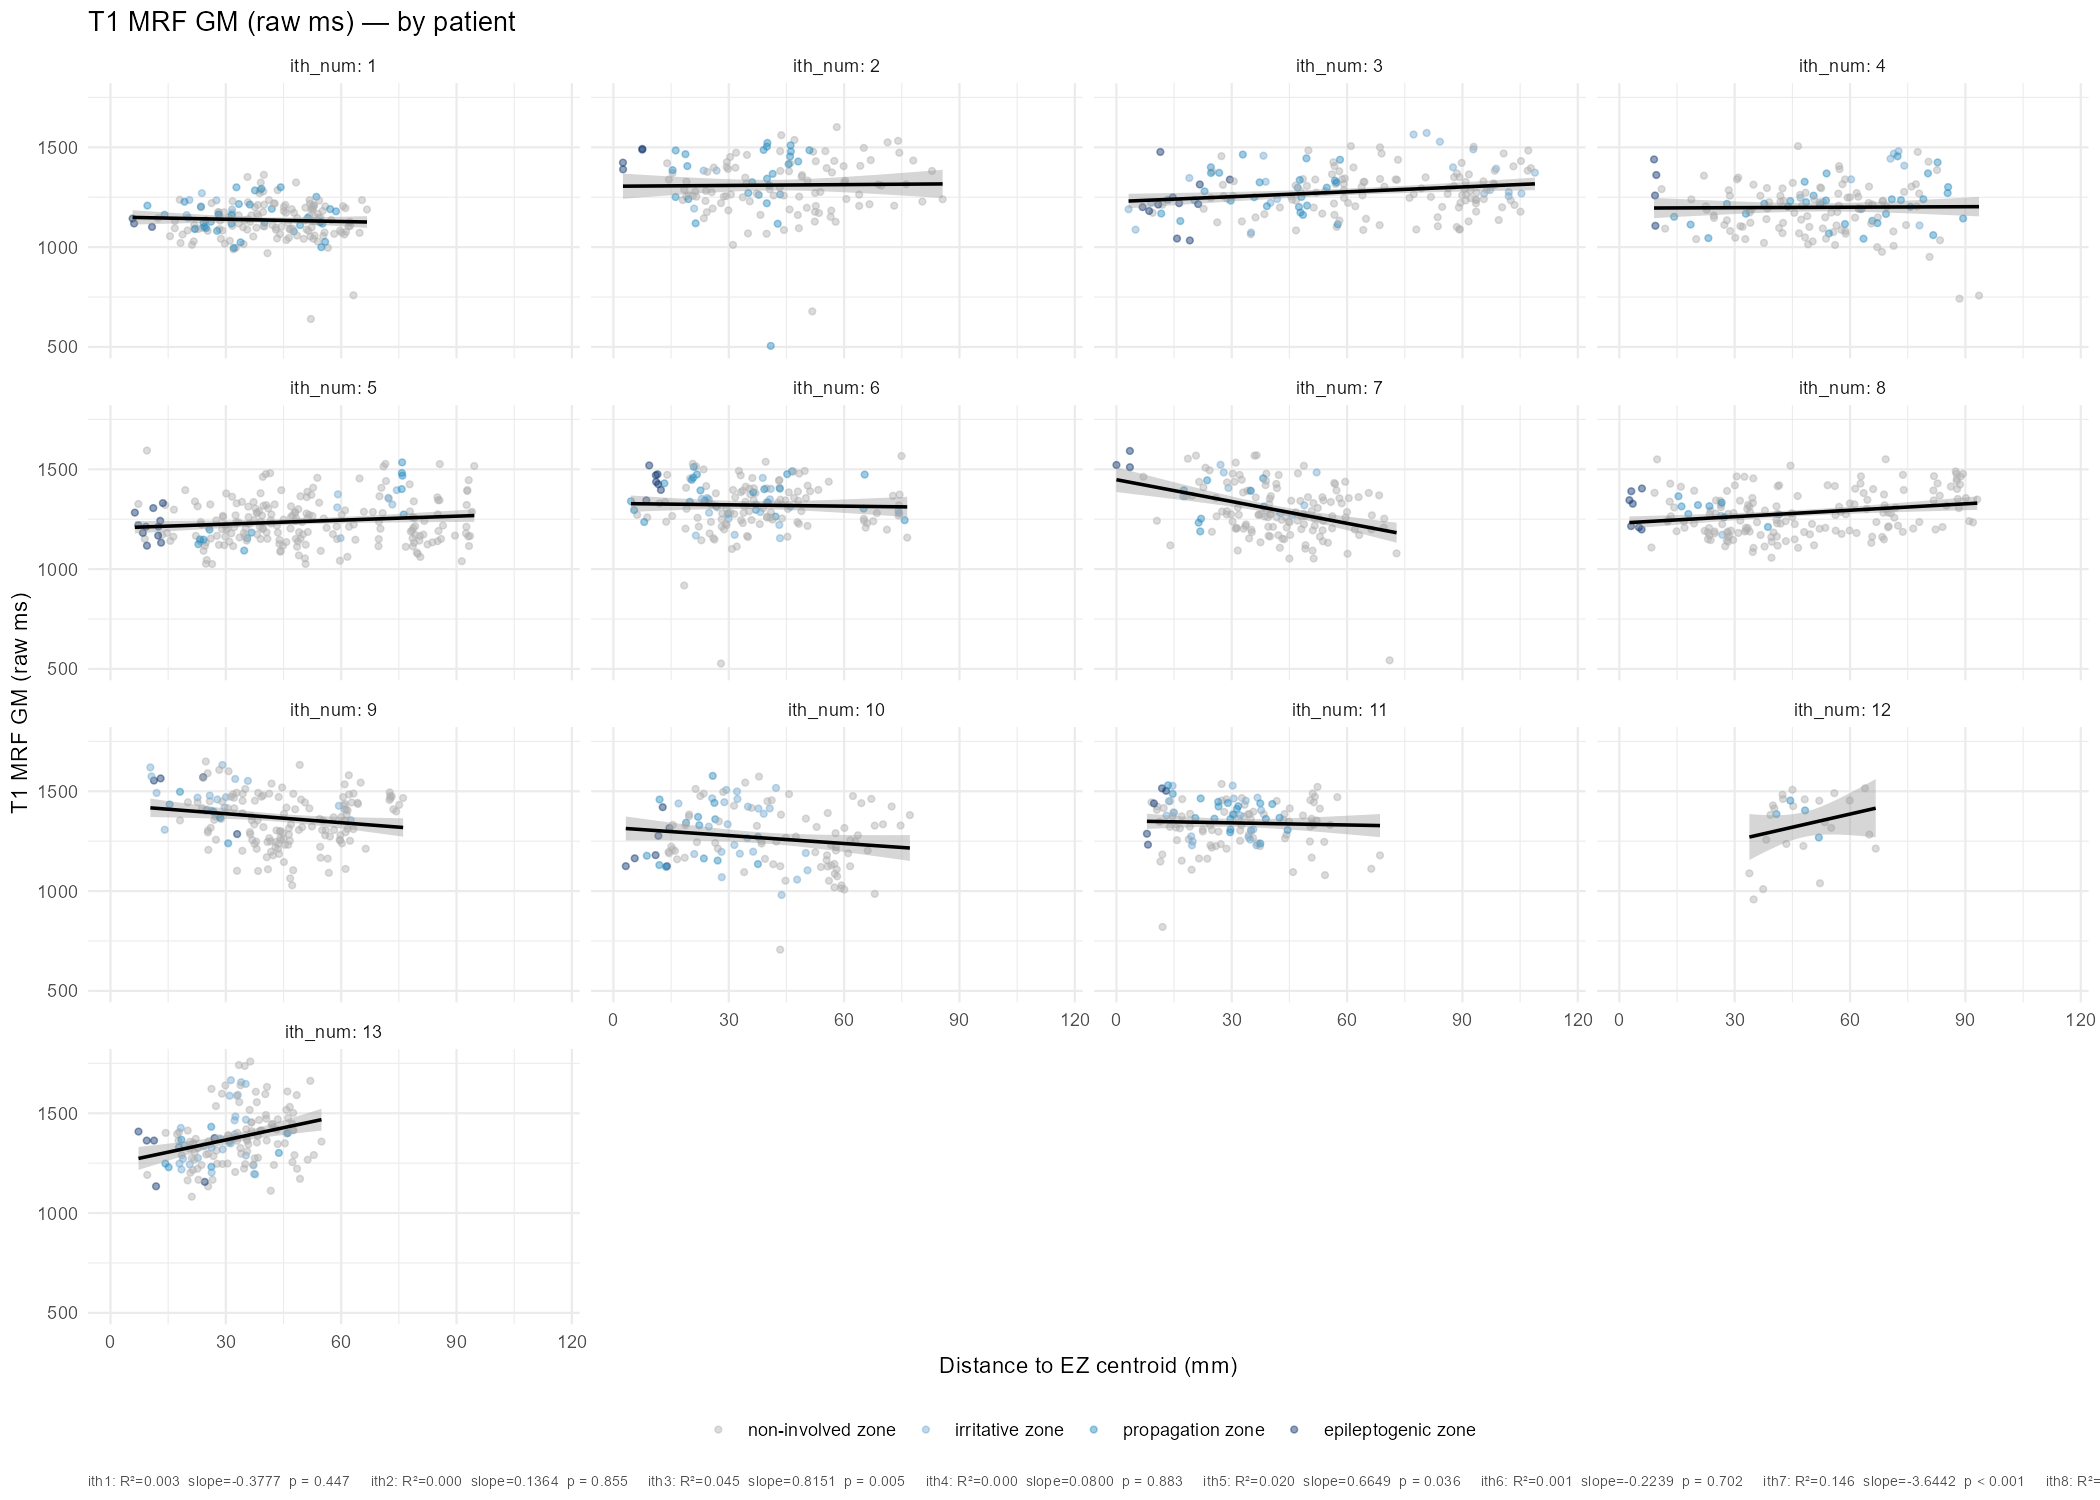
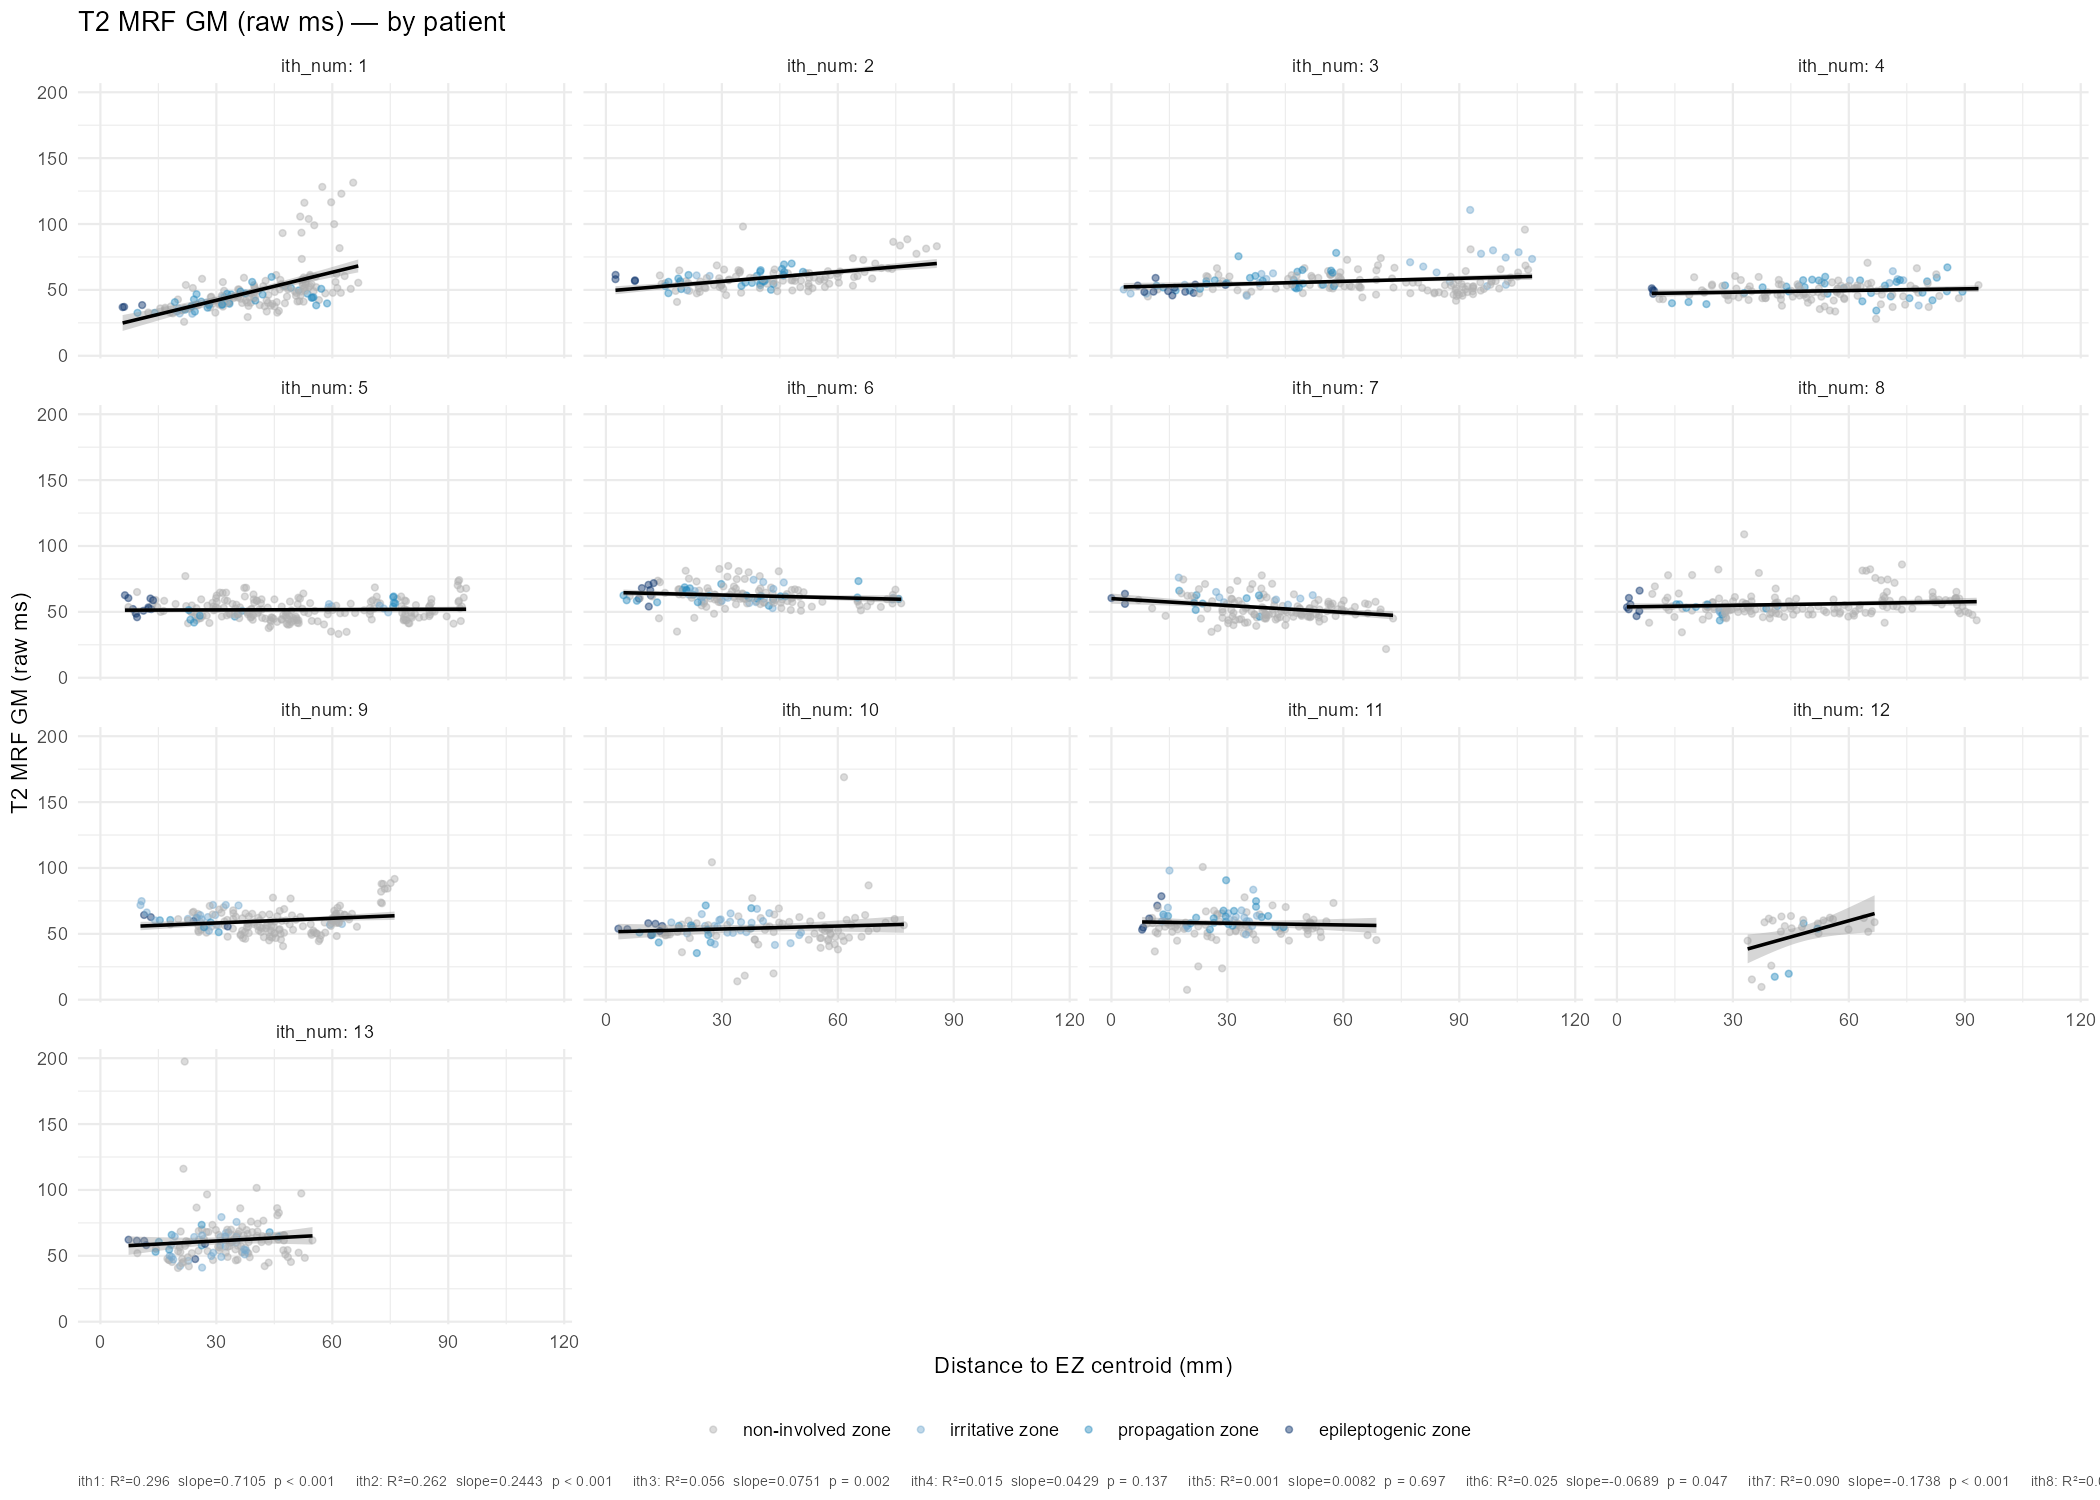
Per-patient findings: Considerable heterogeneity. Expected negative slope (higher MRF near EZ) present in several patients (notably ith7: R²=0.146, slope=-3.64, p<0.001) but absent or reversed in others (ith13: positive slope; ith1: positive T2 slope with R²=0.296). Heterogeneity likely reflects variable etiology, electrode coverage, and the EZ centroid being a crude spatial marker.
VEP z-score: Interpretively cleaner (removes between-patient scaling differences) but T2 VEP z-score distribution is heavily compressed near zero. Notable outlier at normalized distance ~7, z-score ~-65 - under investigation.
Resection labels (June 22)
Post-op MRI downloaded for all available patients. Working on labeling SEEG contacts as resected vs. non-resected based on resection cavity. Current status by patient:
| ith | Resection Contacts | Comments |
|---|---|---|
| ith1 | - | No longer seizure free :( |
| ith2 | - | Have to re-download DICOMs |
| ith3 | - | Have to re-download DICOMs |
| ith4 | X’2-5, P’1-5 | LITT |
| ith5 | V’7-15, D’7-15 | - |
| ith6 | Z9-15, X8-11, J7-11 | - |
| ith7 | - | L OFC FCD |
| ith8 | T1-5, Q1-4 | LITT |
| ith9 | - | - |
| ith10 | - | R T lobectomy, OSH not available in PACS |
| ith11 | I1-8, B7-13, U3-11, T4-8, J12-15, E4-9, A4-11 | - |
| ith12 | - | Have to re-download DICOMs |
| ith13 | F’2-12, O’1-14, W’2-6, X’1-3 | - |
Planned analysis: T1/T2/radiomics within resection cavity vs. concentric rims (e.g. 2mm, further out). Also: met with Alexopoulos this week - see meeting note.
syn7T
BME-X decision (May)
Reviewed FAST-based segmentation outputs comparing baseline 3T, BME-X processed 3T (Arm 1), and true 7T. Arm 1 Dice/IoU deltas centered near zero or slightly negative; WM showed clearest degradation. Visual overlays confirmed BME-X images appear less crisp than baseline 3T.
Decision: Use raw 3T as training input rather than BME-X processed images. BME-X as an input arm could be revisited as a secondary experiment after the primary model is trained.
pix2pix initial run (June 1)
- Train/test/validation split: 36/7/8 subjects
- 2D concatenated slices, unet_256 generator, 256×256 with default resize/crop
- Training time ~8 hours
- Results: mixed - some reasonable synthesis, others with substantial noise and artifacts (edge slices + resize/crop step implicated)
Constrained dataset rerun (June 8)
- Slice inclusion threshold raised from >1% to >10% nonzero area
- Resolution increased to 512×512 with zero padding
- Visual improvement difficult to assess; quantitative iBEAT Dice/IoU evaluation needed
- Issue identified: pix2pix not saving output filenames - some paired 3T/7T slices appeared mismatched, impossible to trace without source filename reference. Fix planned.
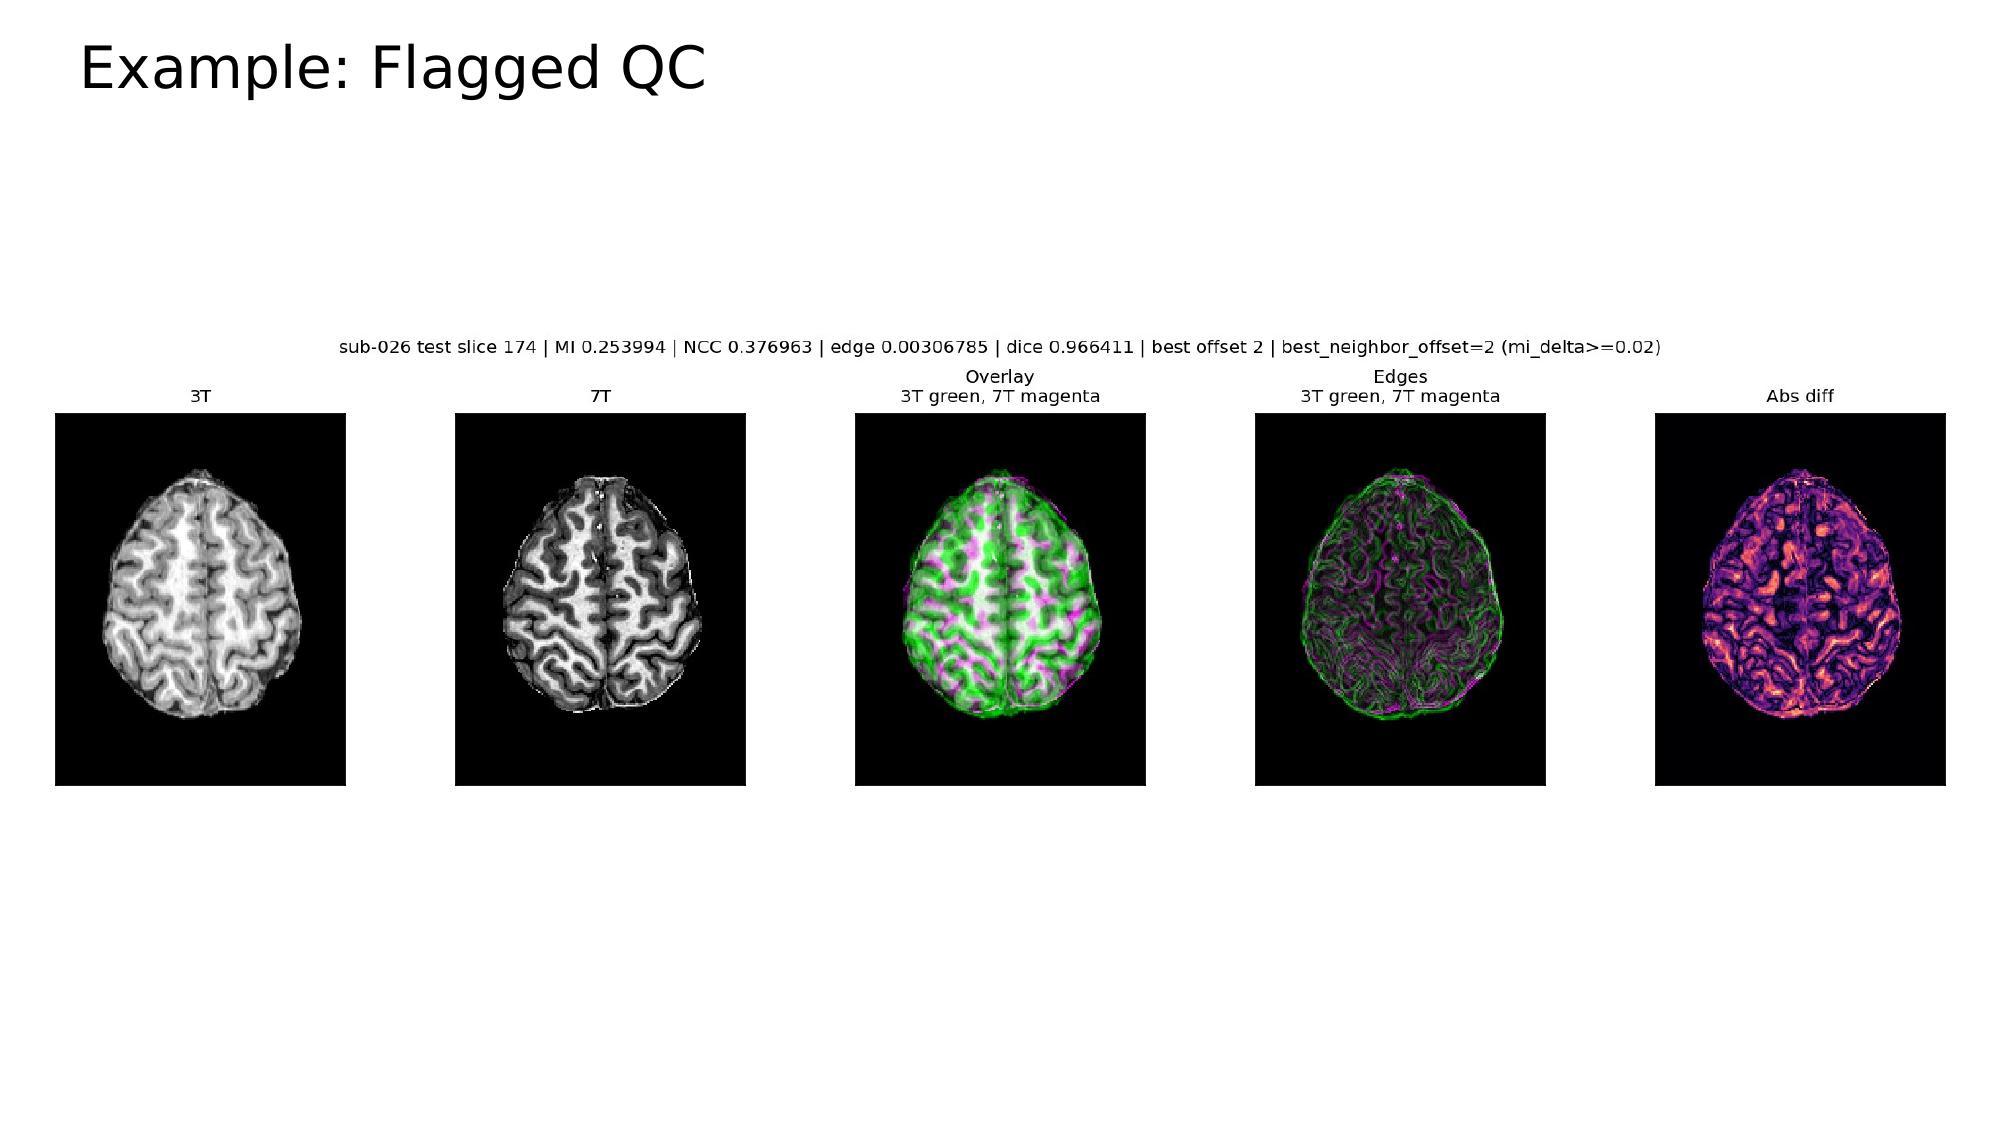
Slice QC pipeline and masked training (June 18)
Mary implemented a multi-metric QC pipeline to flag problematic slice pairs:
| Category | Metric |
|---|---|
| Structural overlap | Dice coefficient |
| Intensity similarity | NCC, Mutual information |
| Anatomical alignment | Edge correlation |
| Slice correspondence | Nearest-neighbor slice matching |
Flagging criteria: NCC/MI below threshold, poor edge correlation, or nearest-neighbor offset ≥ 2 slices (mi_delta ≥ 0.02). Some slices confirmed misaligned on visual review.
Masked L1 loss: Training updated to use an intersection mask between 3T/7T pairs. L1 loss now computed only within shared brain region, decoupling synthesis error from skull-strip/registration differences.
Two parallel runs currently in progress:
- Masked model - full dataset, intersection mask applied during training
- QC-filtered model - unmasked, trained on slices passing QC thresholds
Results pending - will compare both against the prior constrained run using visual assessment + iBEAT Dice/IoU.
HEMI-SLIM
Submitted!